
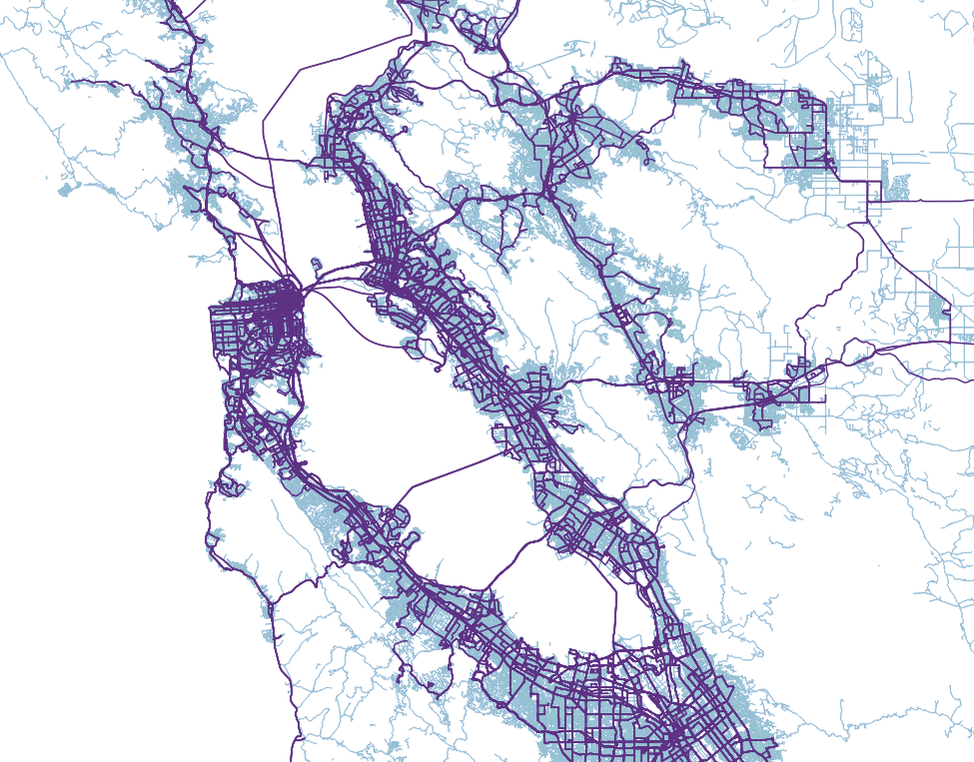
Bay Area Transit System
I collected data from multiple sources representing operators in the Bay Area transportation system. Then I visualized the routes using QGIS.
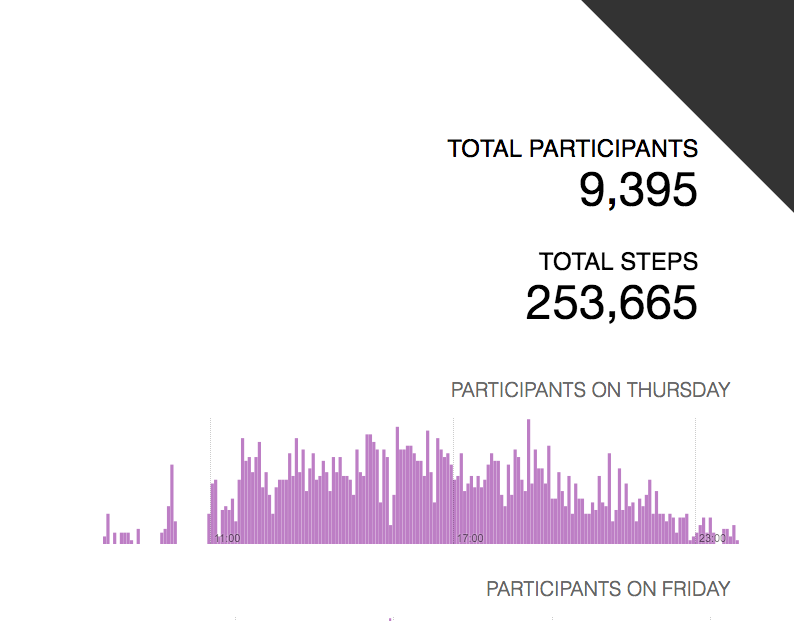
Market Street People Counter
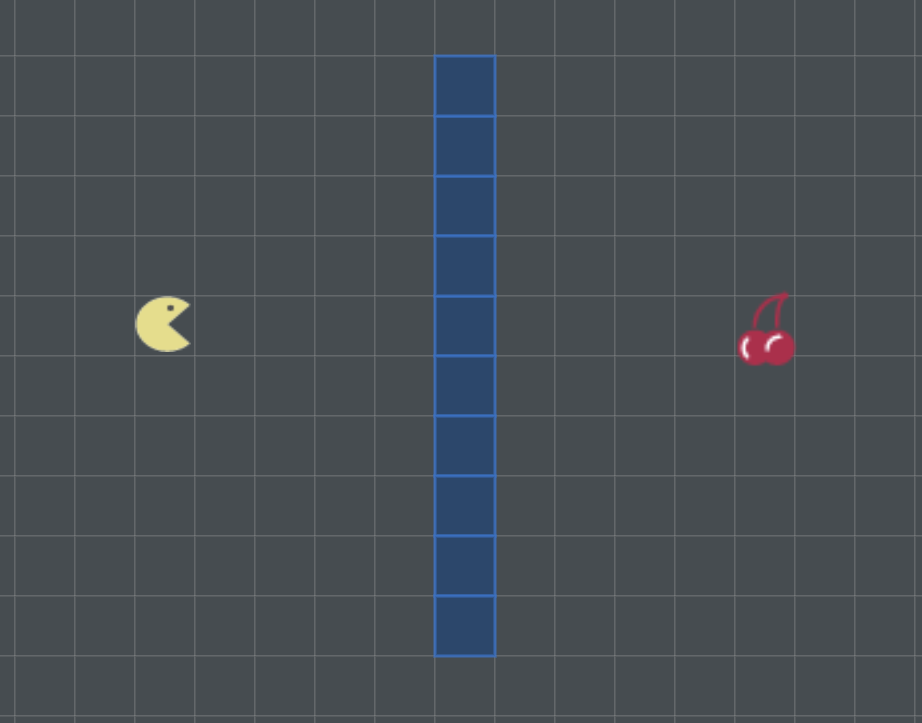
Pacman Pathfinder
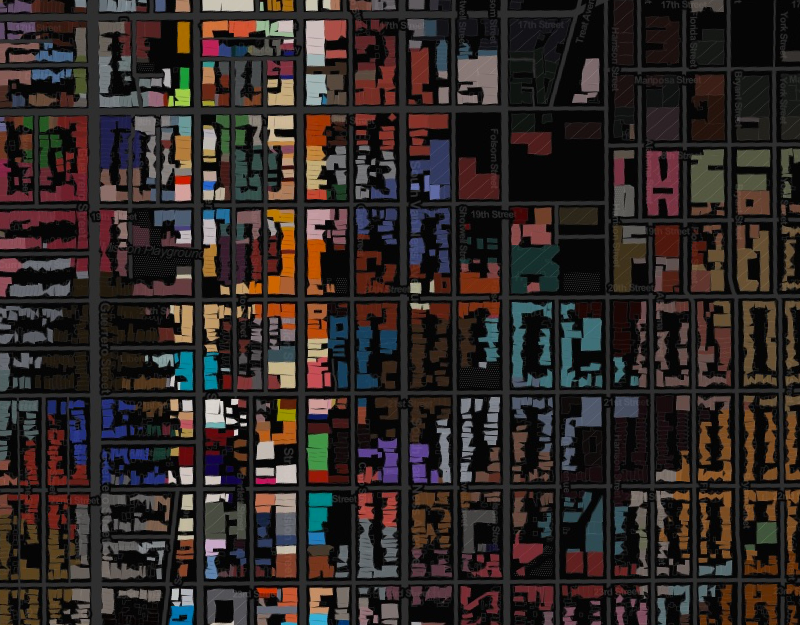
Painting Buildings with Social Color
I sampled colors from social media to visualize building footprints and density, as part of my fellowship with Stamen and Gray Area Arts.
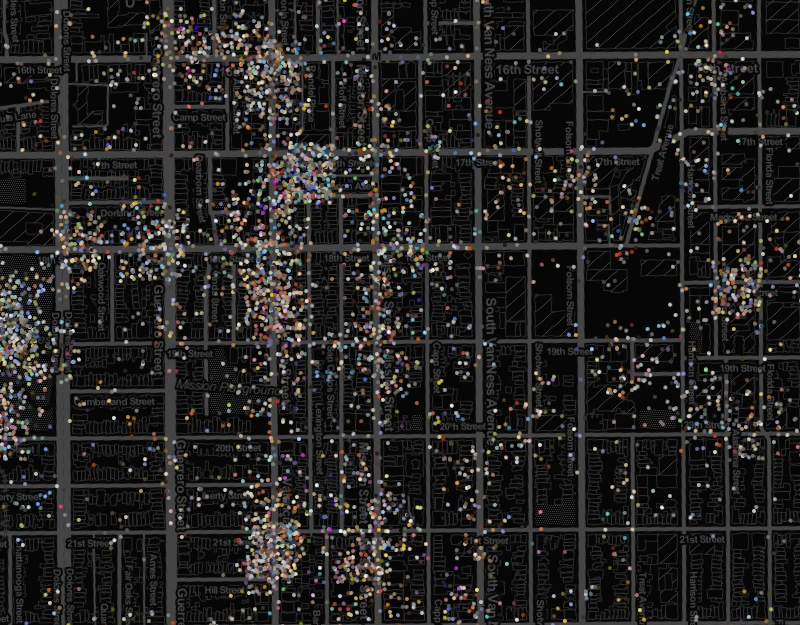
Neighborhood Colors
I analyzed colors from photographs taken in the Mission neighborhood as part of my fellowship work at Stamen and Gray Area.
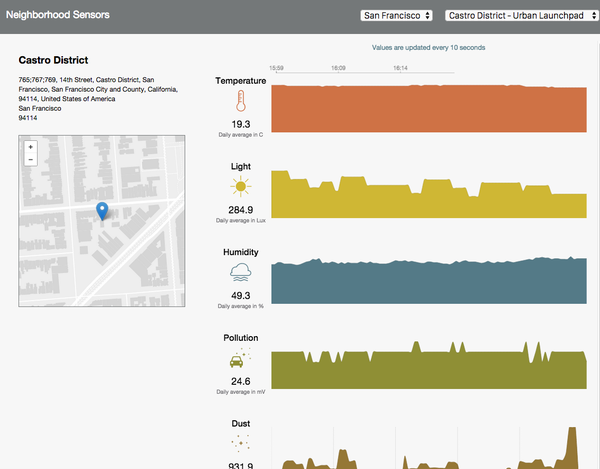
Real-time City Sensors
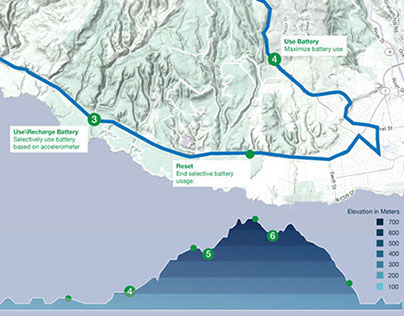
Smart Battery App
Visualization of Ford EV Hackathon project. I used Google elevation service to create a dynamic HTML 5 chart of elevation for the example trip.
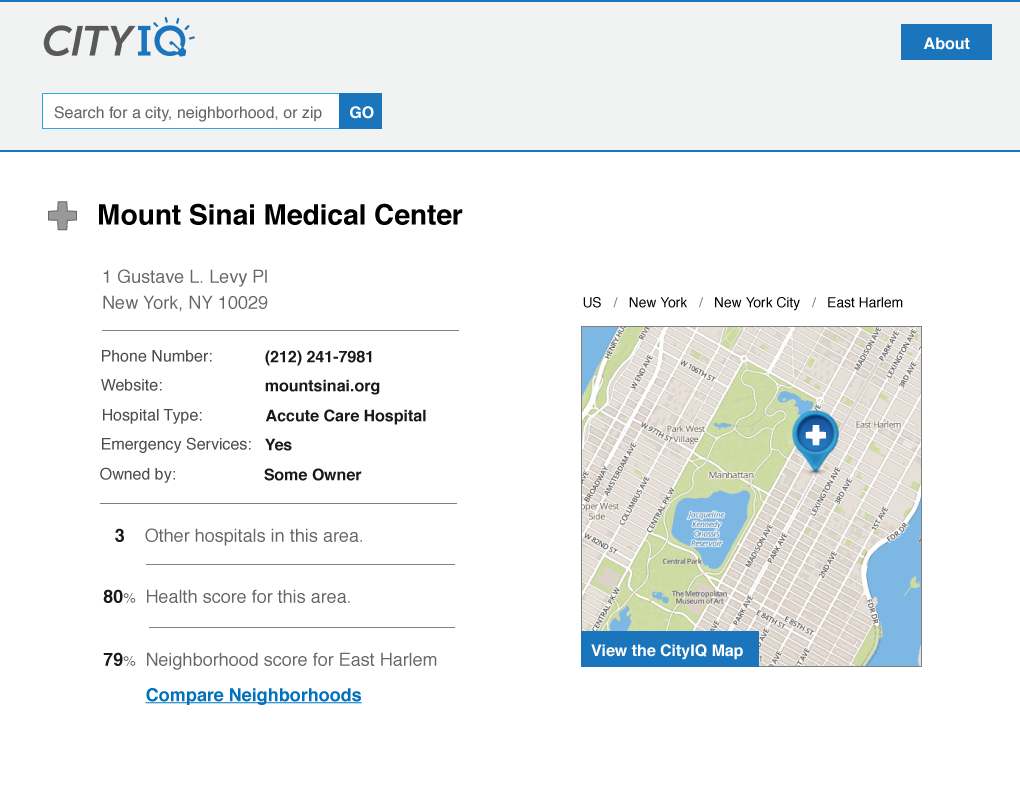
City IQ
I worked with the CityScan team to design and develop and interface for exploring census and lidar data.
UX/UI Design, Prototyping, Maps, Web Development
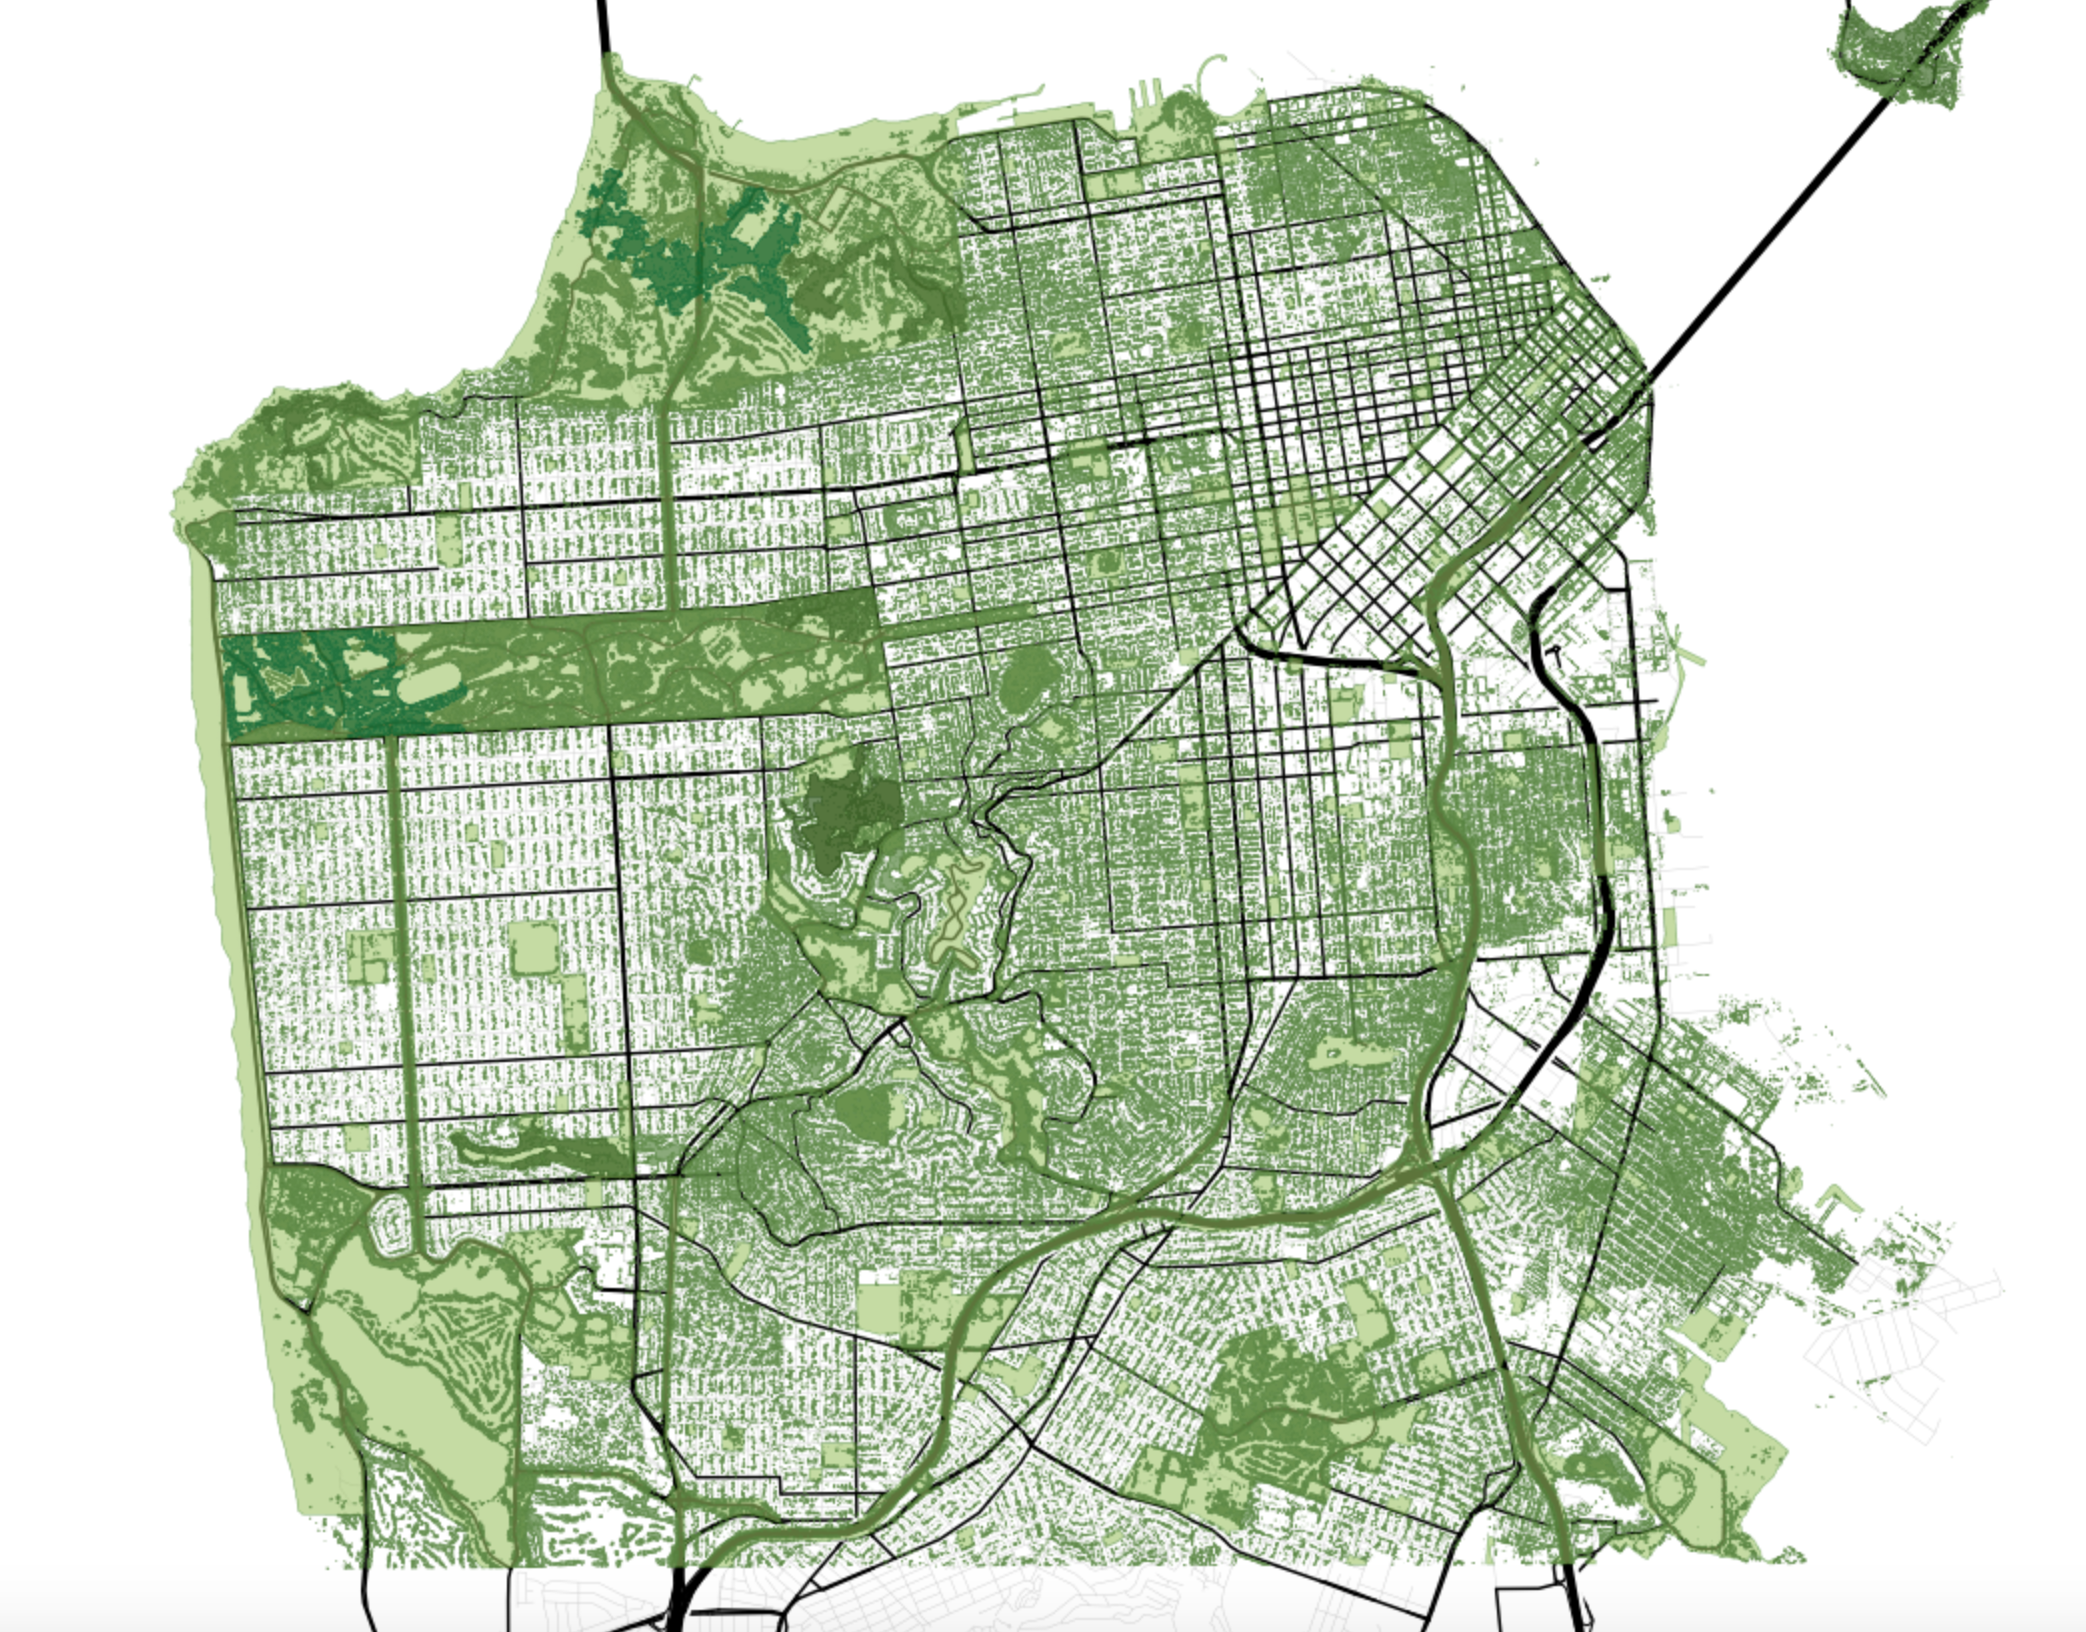
Trees of San Francisco
I took data about trees in San Francisco and visualize their growth on a map of San Francisco using QGIS.
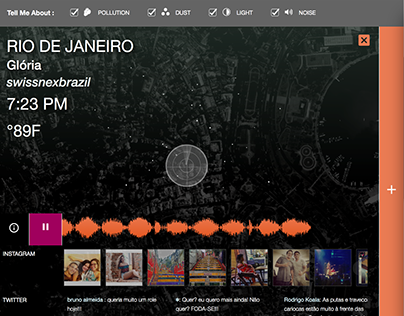
Urban Heartbeat, Experiments with Place
Urban HeartBeat is an civic art project that explores real-time temporal identities and pulses of places in cities around the world.
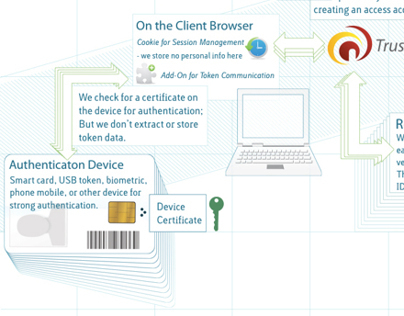
Diagrams and Infographics
I have extensive experience with system and visual diagrams.